
Robustness Scoring
Score
A
B
C
D
E
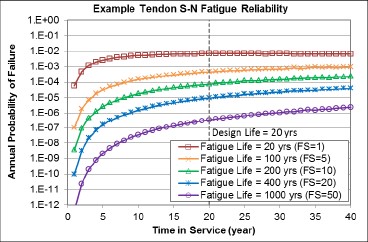
Time in service: year
FPH POF: 1 / (using green line)
Mooring line failure PoF is based on “system failure”, i.e. failure of 2 mooring lines. Methodology is agreed upon with BSEE and can be described by the following three equations:
CBL = c1 x [ 1.58 x vw-100 ]2
(8-line system failure, 2 per quadrant)
CBL = c1 x [ 1.37 x vw-100 ]2
(12-line system failure, 3 per quadrant)
CBL = c1 x [ 1.29 x vw-100 ]2
(16-line system failure, 4 per quadrant)
CBL = Catelogue Break Load
vw-100 = Wind speed for 100-yr event
c1 = Constant relating wind speed to load
Hazard Curve
MLLW:
Chart
Points
Actual (RSR/POF):
/
Lower Bound (RSR/POF):
/
Upper Bound (RSR/POF):
/
Wave In Deck (RSR/POF):
Selected Final (RSR/POF):
/
Actual (RSR/POF):
/
Lower Bound (RSR/POF):
/
Upper Bound (RSR/POF):
/
Wave In Deck (RSR/POF):
Selected Final (RSR/POF):
/
Chart
| Hurricane | Period | Max Shear Force (kips) | Normalized Shear Force (kips) | Air Gap (ft) | Crest Elevation (ft) | Standard Error | Inundation (ft) | BOCD (ft) | Current (ft/s) | Water Velocity (ft/s) | Total Load (kips) | Normalized Total Load (kips) | Normalized WIJ (kips) |
|---|
-
historyChange History ()
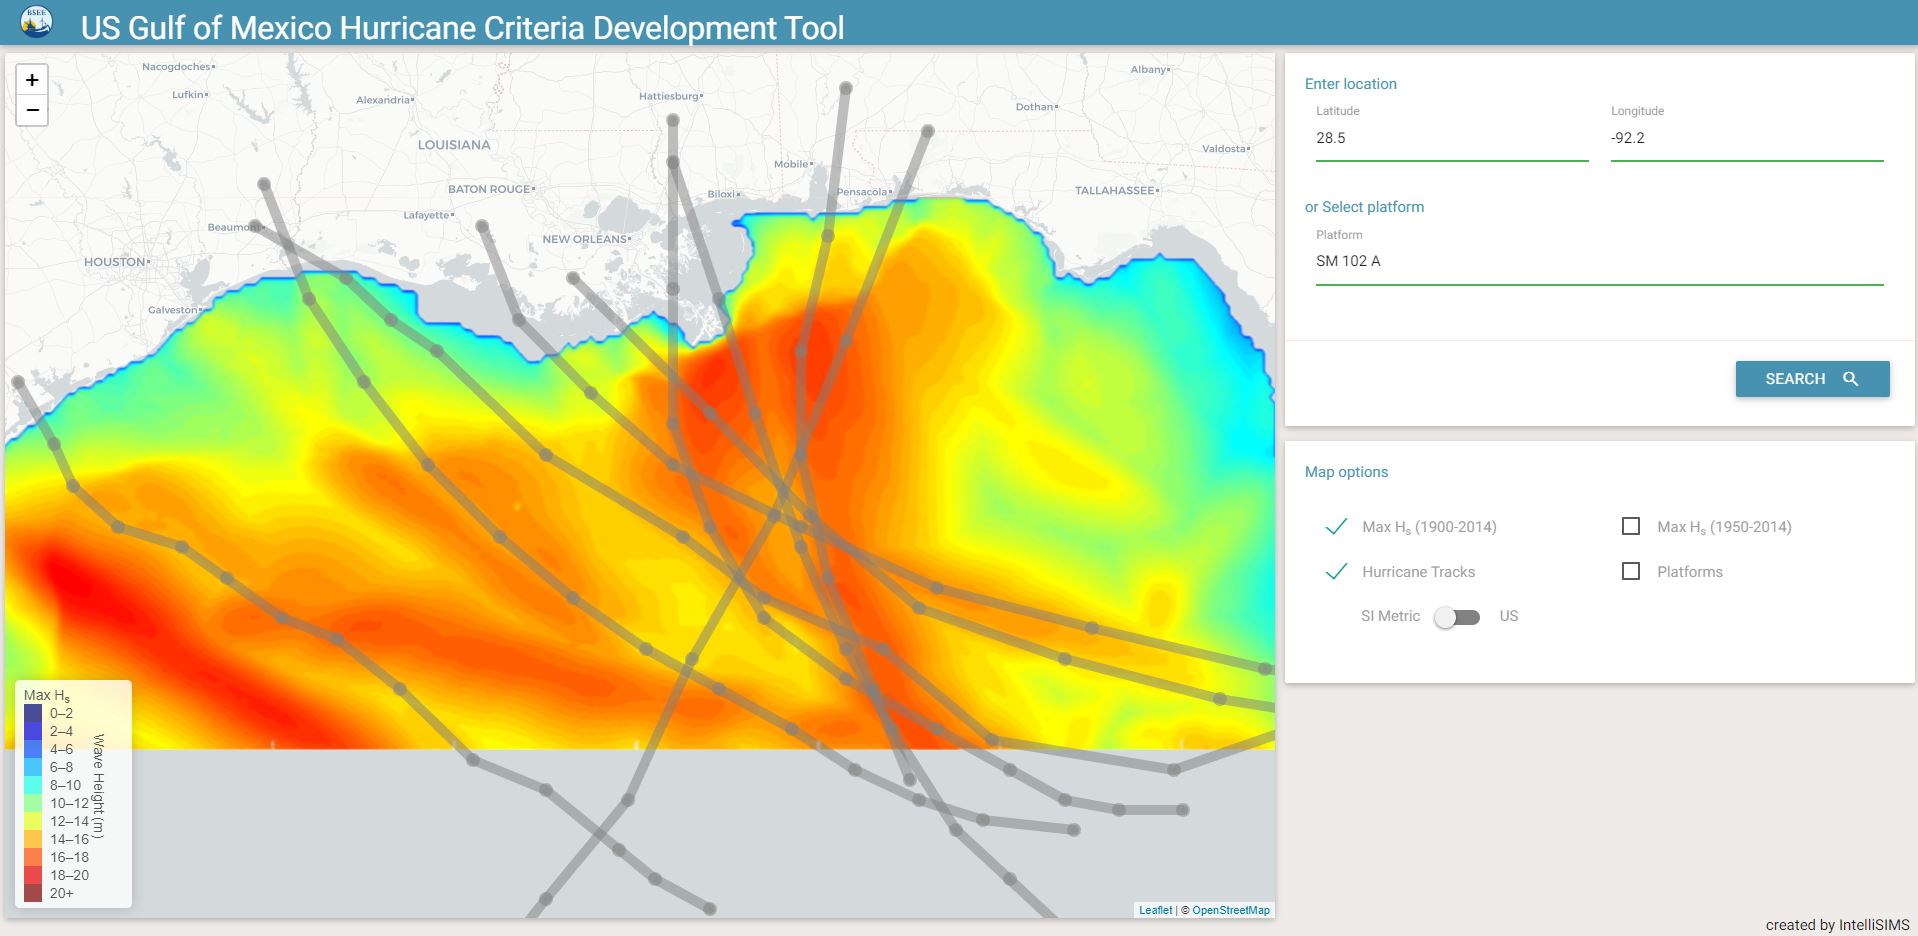
Metocean Criteria
Used Grid Point:
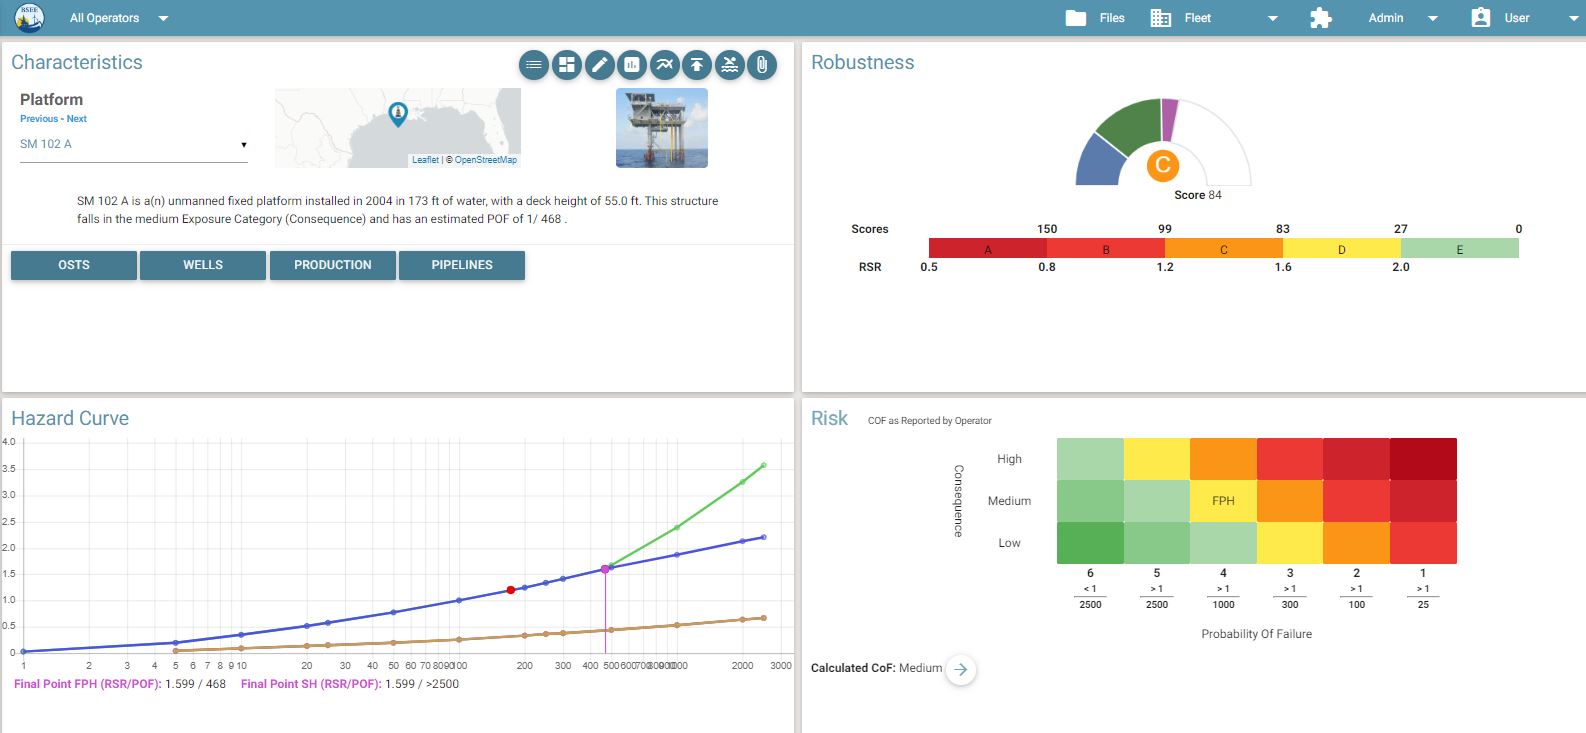
Characteristics

Robustness
A
B
C
D
E
Time in service: year
FPH POF: 1 / (using green line)
Mooring line failure PoF is based on “system failure”, i.e. failure of 2 mooring lines. Methodology is agreed upon with BSEE and can be described by the following three equations:
CBL = c1 x [ 1.58 x vw-100 ]2
(8-line system failure, 2 per quadrant)
CBL = c1 x [ 1.37 x vw-100 ]2
(12-line system failure, 3 per quadrant)
CBL = c1 x [ 1.29 x vw-100 ]2
(16-line system failure, 4 per quadrant)
CBL = Catalogue Break Load
vw-100 = Wind speed for 100-yr event
c1 = Constant relating wind speed to load
Wind Speed, 1-min average (mph)
Risk
COF as Reported by Operator
Consequence |
High | FPH SH | FPH SH | FPH SH | FPH SH | FPH SH | FPH SH |
| Medium | FPH SH | FPH SH | FPH SH | FPH SH | FPH SH | FPH SH | |
| Low | FPH SH | FPH SH | FPH SH | FPH SH | FPH SH | FPH SH | |
| 6 < 1 2500 |
5 > 1 2500 |
4 > 1 1000 |
3 > 1 300 |
2 > 1 100 |
1 > 1 25 |
||
|---|---|---|---|---|---|---|---|
| Probability Of Failure | |||||||
Images Upload
Upload image files for the platforms with the name of the files like CPXID+STN.jpg (or .png).
Example: 2641.jpg for platform with CPXID 264 and STN 1.
OSTS
Well
Production
Upload files
See an example here: ExampleTemplate.xlsx
Download Format Conversion Tool here: Conversion_Tool.xlsm
Upload file MUST have one of the following SHEETNAME :
- Operators
- Platforms
- Platform Characteristics
- Pipelines
- Production
- OSTS Inspection Data
- Wells
Consequence of Failure
Exposure Category Matrix
| Consequence Category | ||||||
|---|---|---|---|---|---|---|
|
Life Safety Category
|
C-1 | C-2 | C-3 | |||
| S-1 Manned-nonevacuated | - | - | - | H = L1 | ||
| S-2 Manned-evacuated | - | - | - | M = L2 | ||
| S-3 Unmanned | - | - | - | L = L3 | ||
CoF Data
Environmental
API
Maximum Pipeline Size
Hazard Curves Recalculation
Recalculate curves older than (leave it empty to run not processed or updated platform only):
Processing. Finished platforms of .
Processing. Getting data from database.
-
Calculation results
CPXIDStatusMessage